 CommSec
31 Jan 2023
What have you resolved to do in 2023? Lose weight? Eat healthier? Or perhaps get fitter with the goal of running a marathon!
As always we have good intentions with our New Year resolutions. But we’ll see how many are following through on the goals in a few months’ time.
What about your finances? You also may want to pay more attention to your finances. But where to start?
A little example may provide you with the inspiration you are looking for.
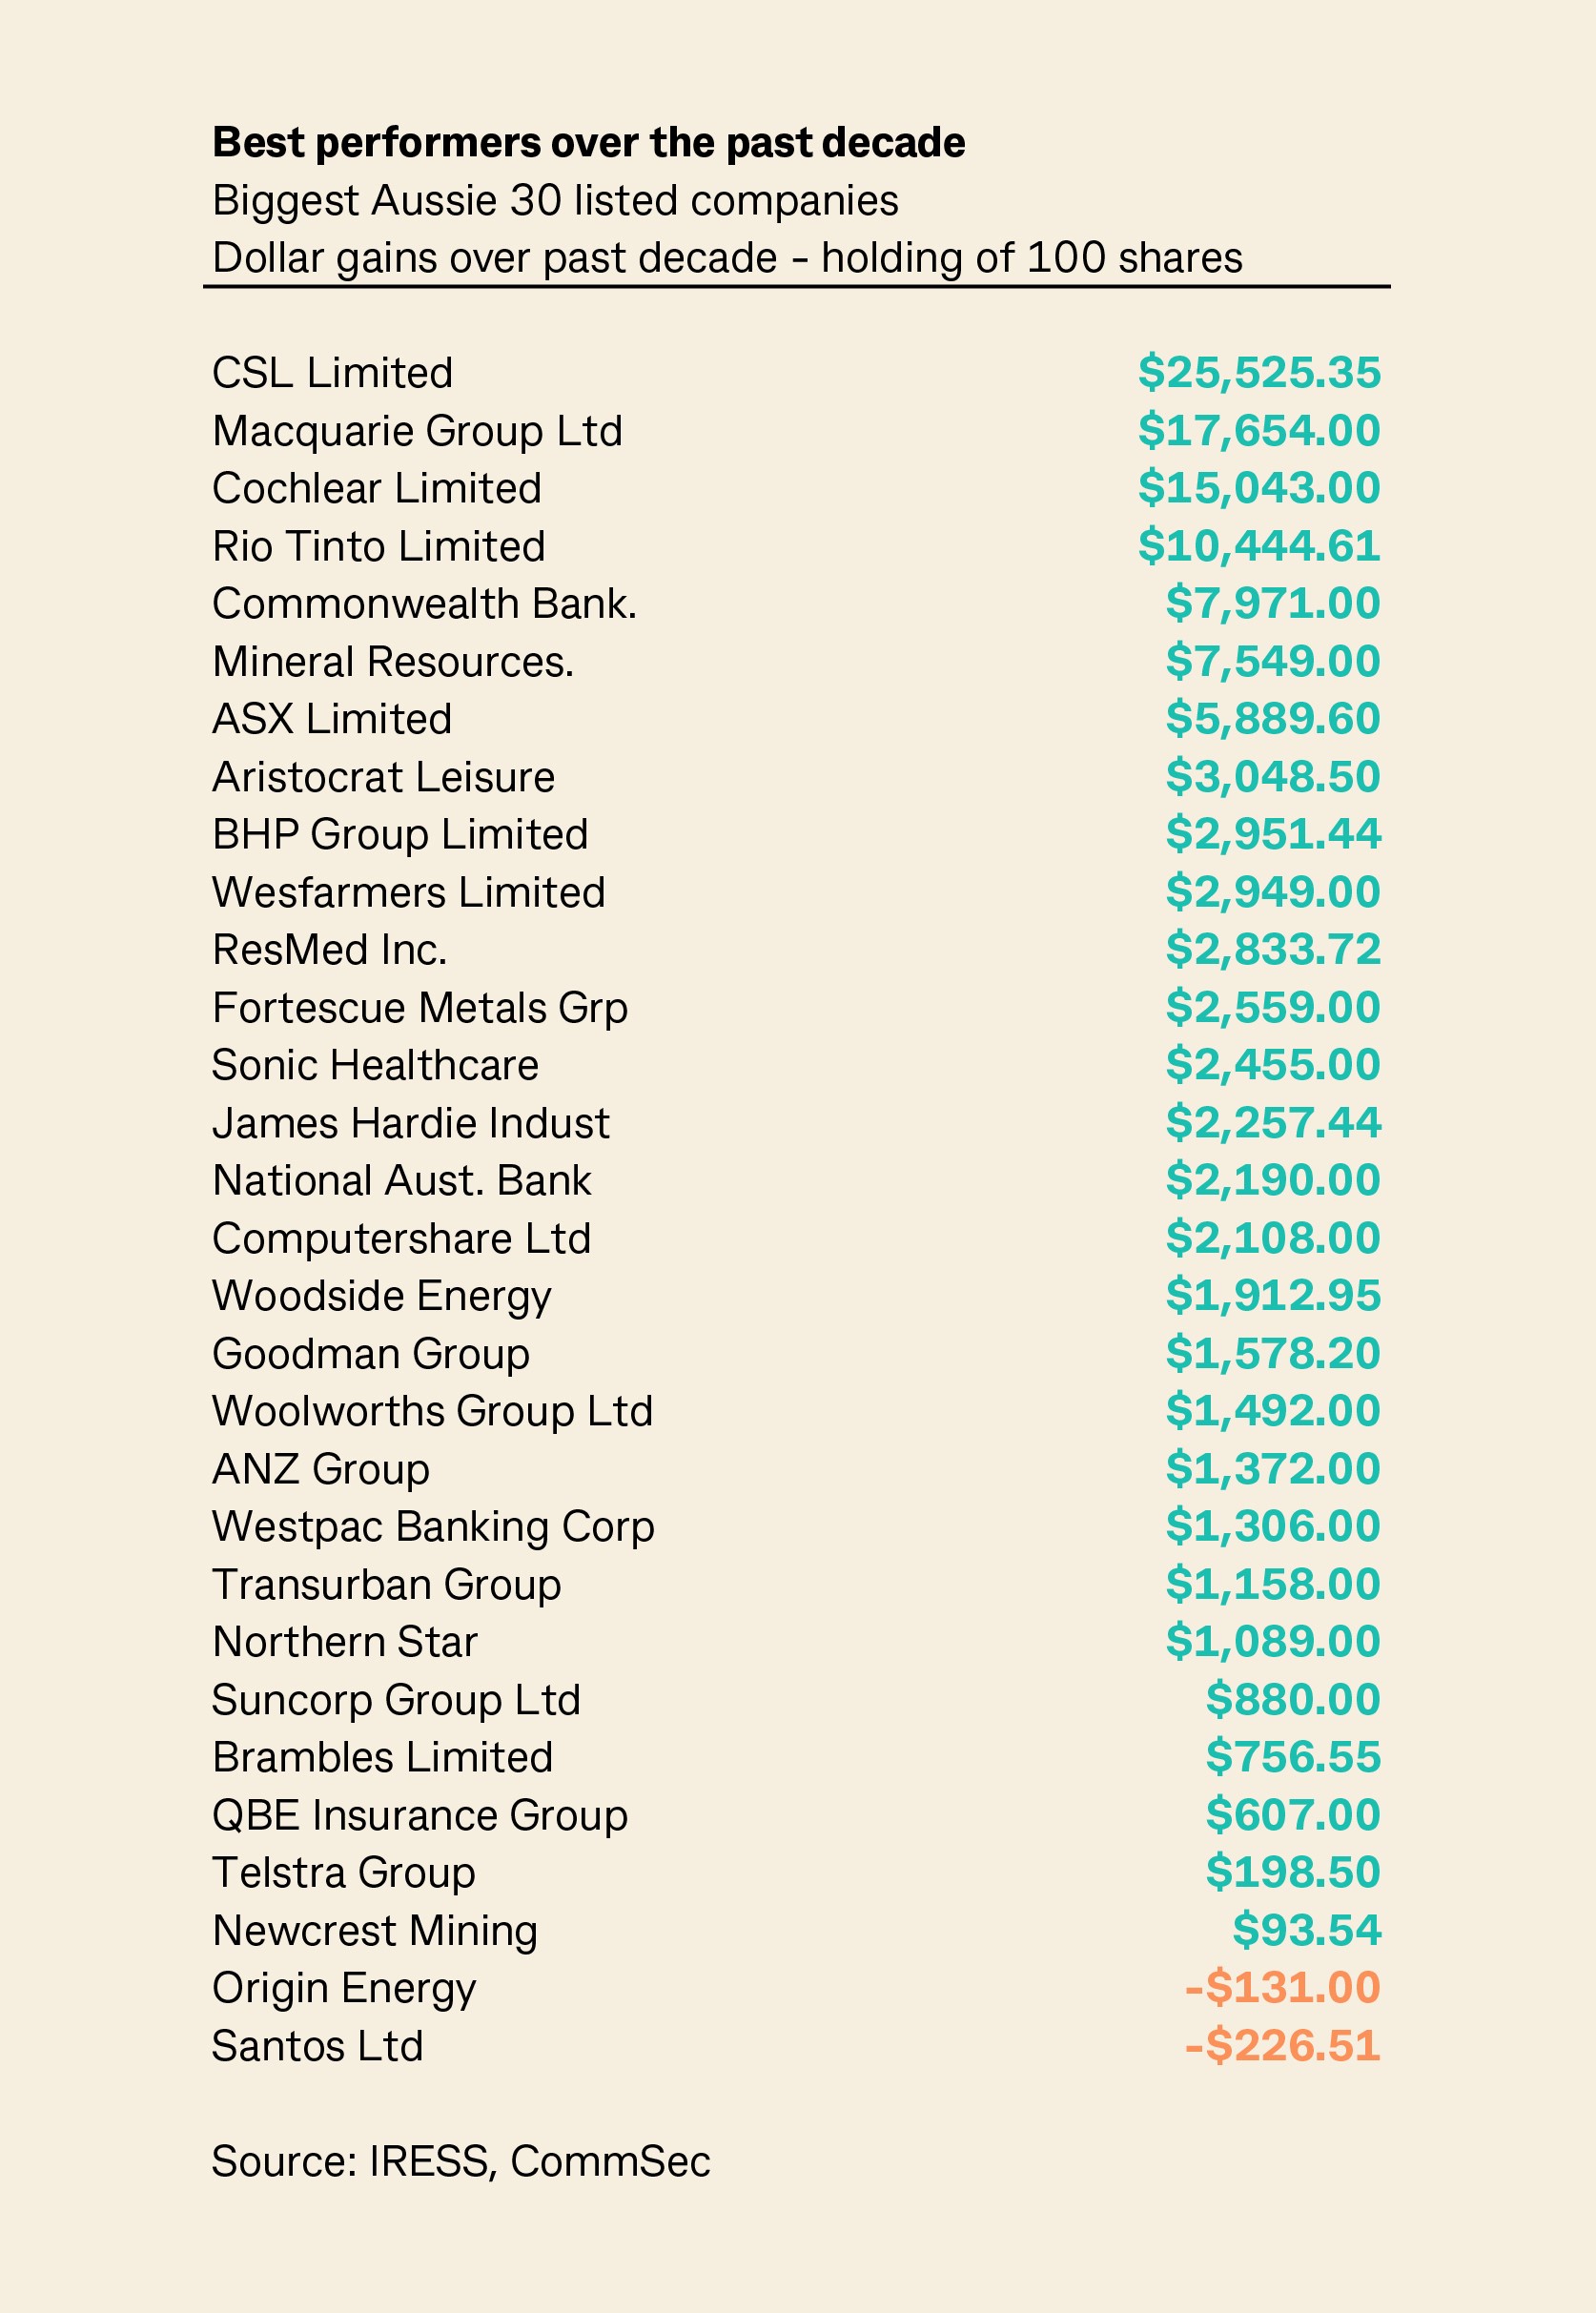
We have identified the returns on the top 30 listed companies (by market capitalisation) based solely on share price performance and dividends paid over the last 10 year period for a holding of 100 shares.
The data on share prices and dividends are supplied by Iress and the total return calculation assumes that the dividends are not reinvested over time.
The net dollar returns are calculated as: (100*(end 2022 share price + dividends from 2013-2022))-(end 2012 share price *100).
Results from other vendors such as Bloomberg may be slightly different due to different calculations and data collections.
Costs, fees or taxes are not included.
CSL Limited: A stand-out investment
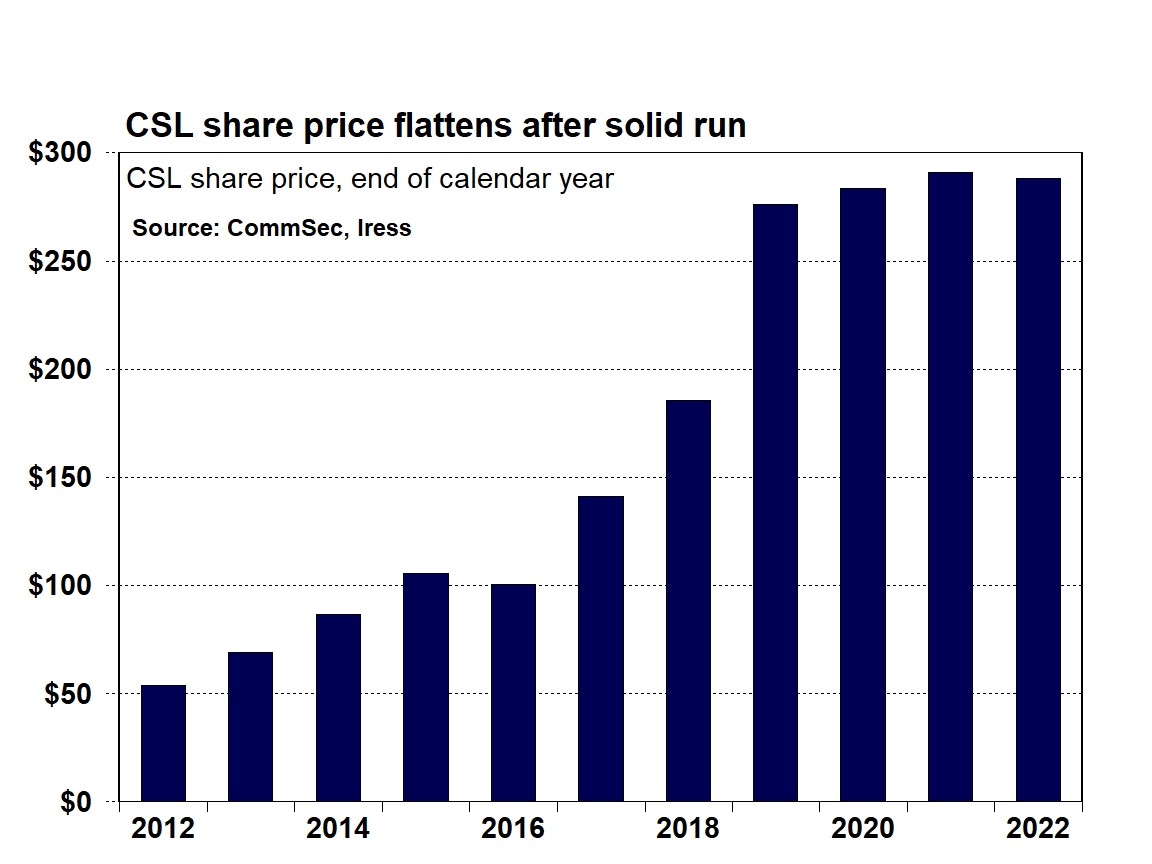
If you bought 100 shares in biotechnology company, CSL Limited (CSL), a decade ago it is likely that you would be pretty happy about that decision.
On paper, the near $5,500 investment in CSL at the end of 2012 would have been valued at almost $29,000 at the end of the 2022 calendar year – a gain of over 400 per cent.
Further, if you held the investment over the entire period, you would have also picked up the dividends paid out by the company. Excluding brokerage and other costs, the holding of 100 shares over the decade would have produced a net gain on the investment of over $25,500.
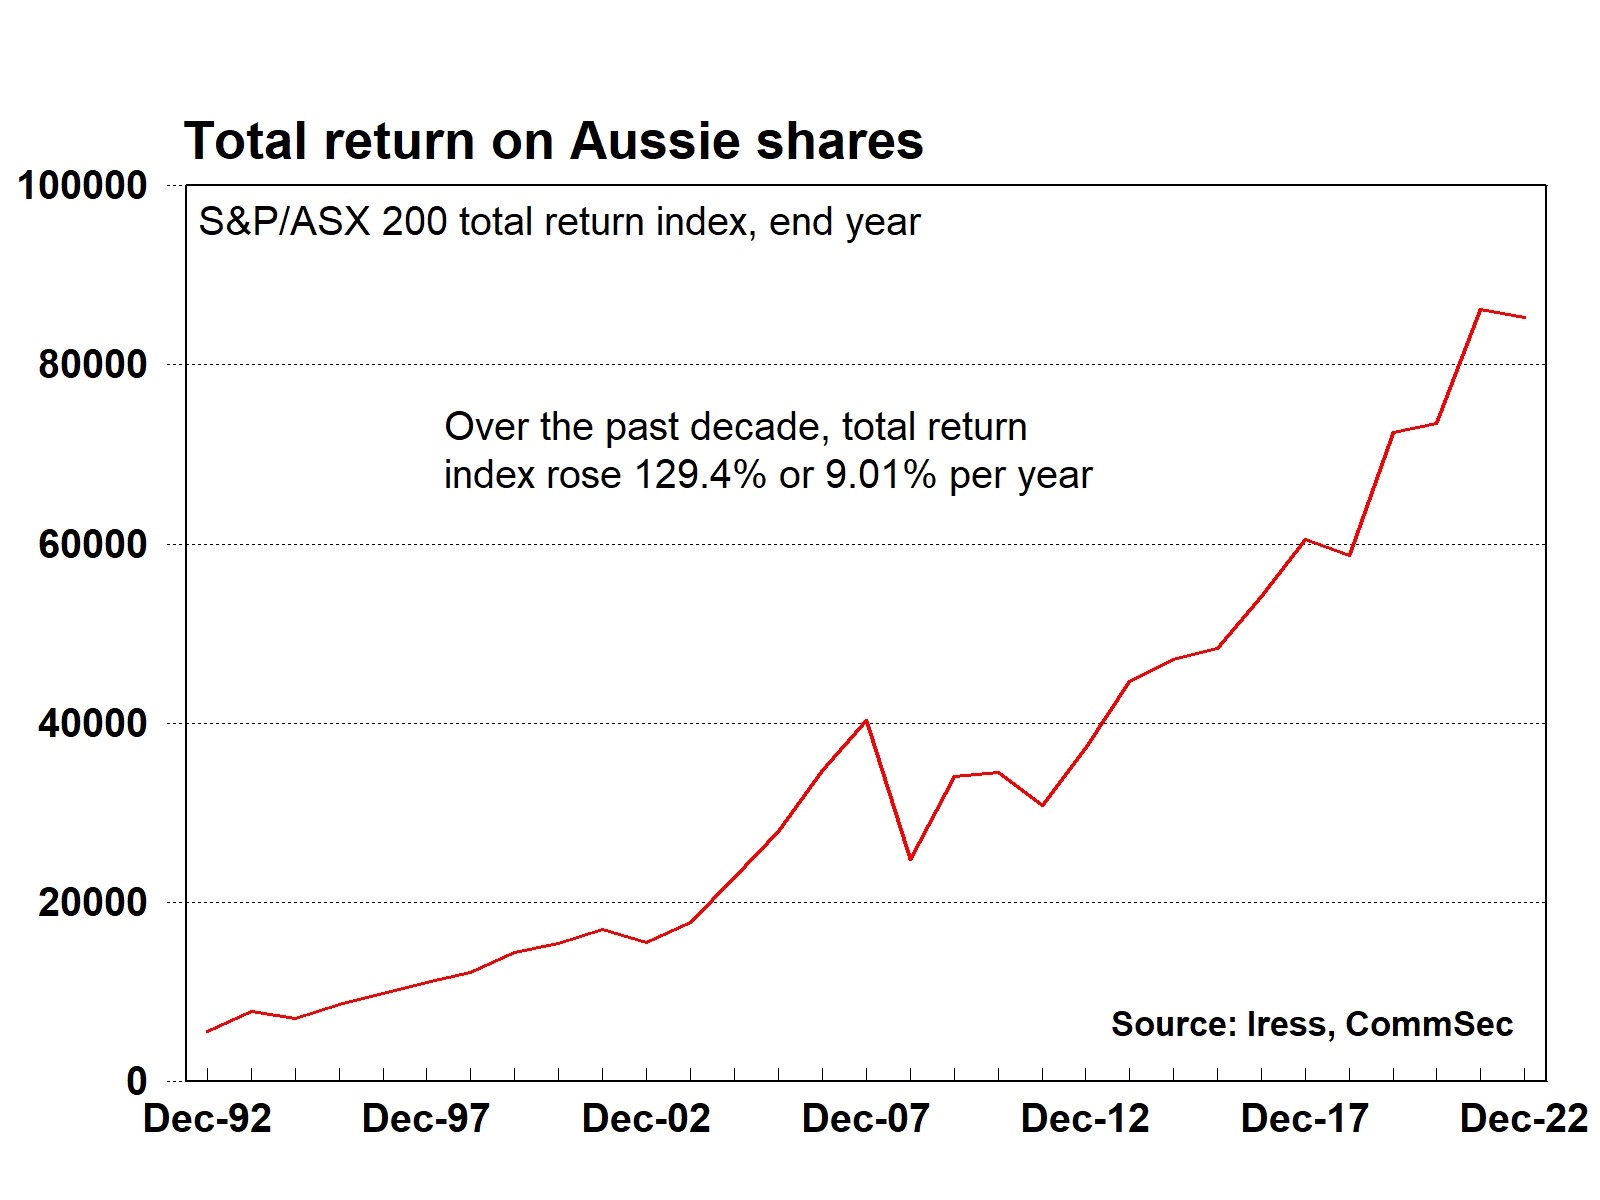
In percentage terms, CSL generated a return of almost 475 per cent over the period from the end of 2012 through to the end of 2022. By comparison, total returns on the ASX 200 index grew by 129.4 per cent over the same period.
The top four over the past decade
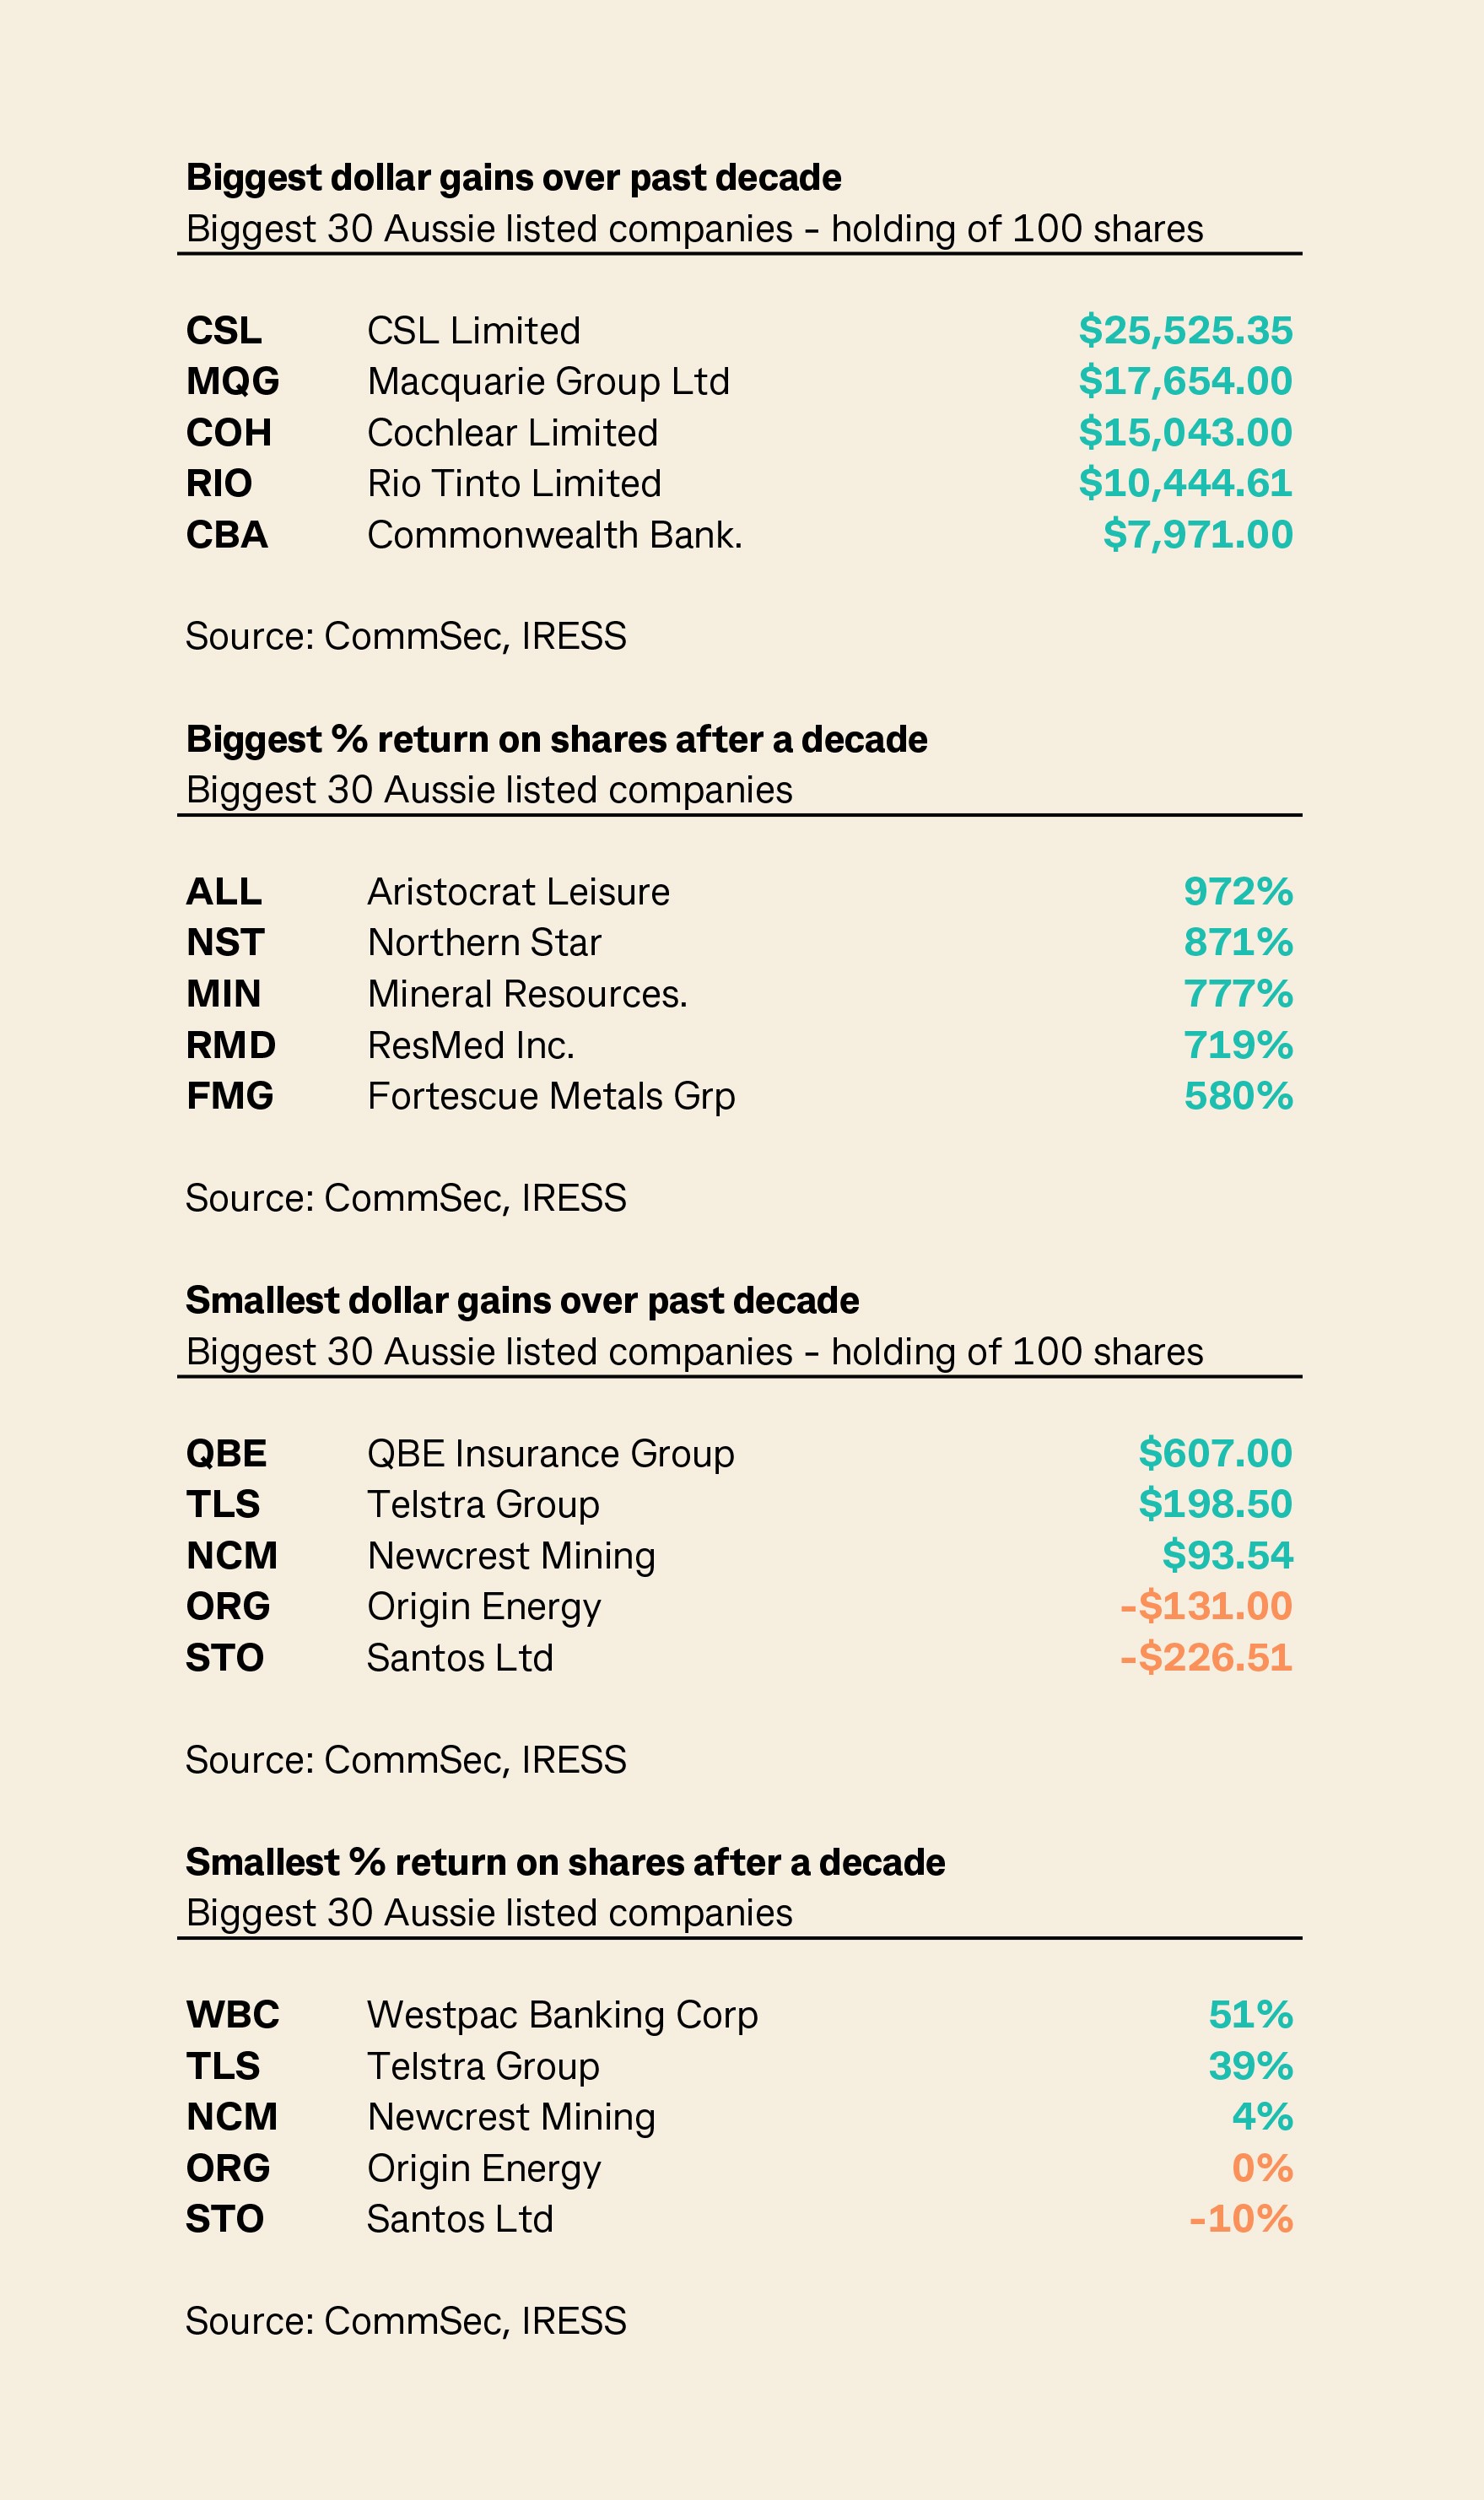
So in dollar terms what have been the best performers over the last decade when looking across Australia’s 30 largest listed companies? As noted, at number one was CSL with a net gain of over $25,525. Number 2 was Macquarie Group ($17,654); ahead of Cochlear ($15,043); and Rio Tinto ($10,445).
As noted, this analysis is confined to the 30 biggest Australian stocks by market capitalisation. But it should provide a catalyst for study of other companies listed on the Australian Stock Exchange, especially those in the S&P/ASX 200 index.
In the ASX 200, around 90 stocks exceeded sector average growth over the past decade on share price appreciation alone (source: Iress). And looking at dollar returns, one notable result by a company outside the sample was by property group REA, generating net returns of just over $12,000 over the past decade on a holding of 100 shares.
Source: CommSec calculations on Iress data.
The ‘winners’ circle
1. CSL (CSL)
The acronym CSL stands for the Commonwealth Serum Laboratories. That is what the company was called when it was under government ownership, that is, before it was sold in 1994. CSL is Australia’s biggest, and one of the world’s largest, biotech companies. CSL’s operations focus on blood plasma products that provide therapies or treatments for disease and it also produces vaccines and medicines.
It is important to note that CSL has been a solid performer over time, in fact its share price has lifted 28 per cent per year over the past 28 years.
CSL operates efficiently in industries and market sectors that have limited competition, providing it with that all-important ingredient of price leadership in a number of its sectors.
Of 20 equity market analysts surveyed by Market Index, 17 regard CSL as a ‘buy’ and the other three rank it as a ‘hold’. Similarly, 15 out of 19 analysts surveyed by Bloomberg have a ‘buy’ rating on the stock.
Source: Iress https://www.marketindex.com.au/broker-consensus ; Bloomberg; Goldman Sachs; Motley Fool
The ‘winners’ circle
2. Macquarie Group Ltd (MQG)
Macquarie is Australia’s fifth biggest bank by market capitalisation. While retail banking has importance for the ‘big 4’ banks, the focus of operations for Macquarie is investments, advisory and asset management.
Over the past decade, the Macquarie share price has had a zig-zag run, but the gains in 2013, 2015 and 2021 have more than offset more modest performances in other years, including the 18.7 per cent fall in 2022.
The average annual share price gain over the past decade was 19.1 per cent, ahead of the 4.6 per cent lift in the ASX 200 index.
Looking ahead, equity market analysts are divided on the outlook for Macquarie, with concern about the impact on its investment banking business in a global recession. Having said that, the share price has lifted 18 per cent in the past three months with investors perhaps encouraged by Macquarie’s self-professed conservative balance sheet. According to Bloomberg, there are 9 out of 14 ‘buy’ ratings on the stock.
Source: Iress; https://www.marketindex.com.au/broker-consensus; Bloomberg
The ‘winners’ circle
3. Cochlear Limited (COH)
Cochlear specialises in the production of ear implant technology. Similar to CSL, Cochlear has few rivals in its chosen market segments. So it can exercise a degree of price leadership. The company has operated for over 30 years.
The 12.1 per cent average annual gain in Cochlear’s share price was largely generated over 2014-2017. Over the last three years, the share price has only lifted on average by 2.4 per cent.
Equity market analysts are divided on the outlook for Cochlear. Overall it has a ‘hold’ rating with five of 22 brokers rating Cochlear a ‘buy’ and nine rating it as a ‘sell’ according to Market Index It’s a mixed picture from Bloomberg’s analyst survey with seven ‘buys’ and five ‘sells’ in analyst ratings on the stock.
Source: Iress; https://www.marketindex.com.au/broker-consensus; Bloomberg
The ‘winners’ circle
4. Rio Tinto Limited (RIO)
Rio Tinto has been around for a while – in fact since 1873 – and is one of the world’s biggest diversified mining companies. The company mines a raft of key raw materials or commodities including base metals like aluminium and copper as well as iron ore and lithium.
Over the past decade, RIO has seen its share price rise by 7.5 per cent a year, not markedly ahead of the 4.6 per cent gain for the broader ASX 200 index. But the high dollar value of returns over the decade has been boosted by consistent and solid dividends paid to shareholders.
Total return on shares – share price and dividends – grew by 145 per cent over the decade, ranking it 15th of Australia’s biggest 30 companies.
Looking ahead, 11 of 22 equity market analysts rate RIO as a ‘buy’ with only two as a ‘sell,’ according to Market Index. For Bloomberg, analysts have 8 ‘buy’, 6 ‘hold’ and 4 ‘sell’ recommendations. The outlook depends on continued recovery for the Chinese economy and slowdown - but not shutdown - of other major economies.
Source: Iress; https://www.marketindex.com.au/broker-consensus; Bloomberg
What if the focus is on growth, not dollar returns?
Our ‘winners circle’ features the dollar returns of Australia’s 30 biggest companies over the past decade. But what if growth, not dollars, was the focus, what would the list look like then?
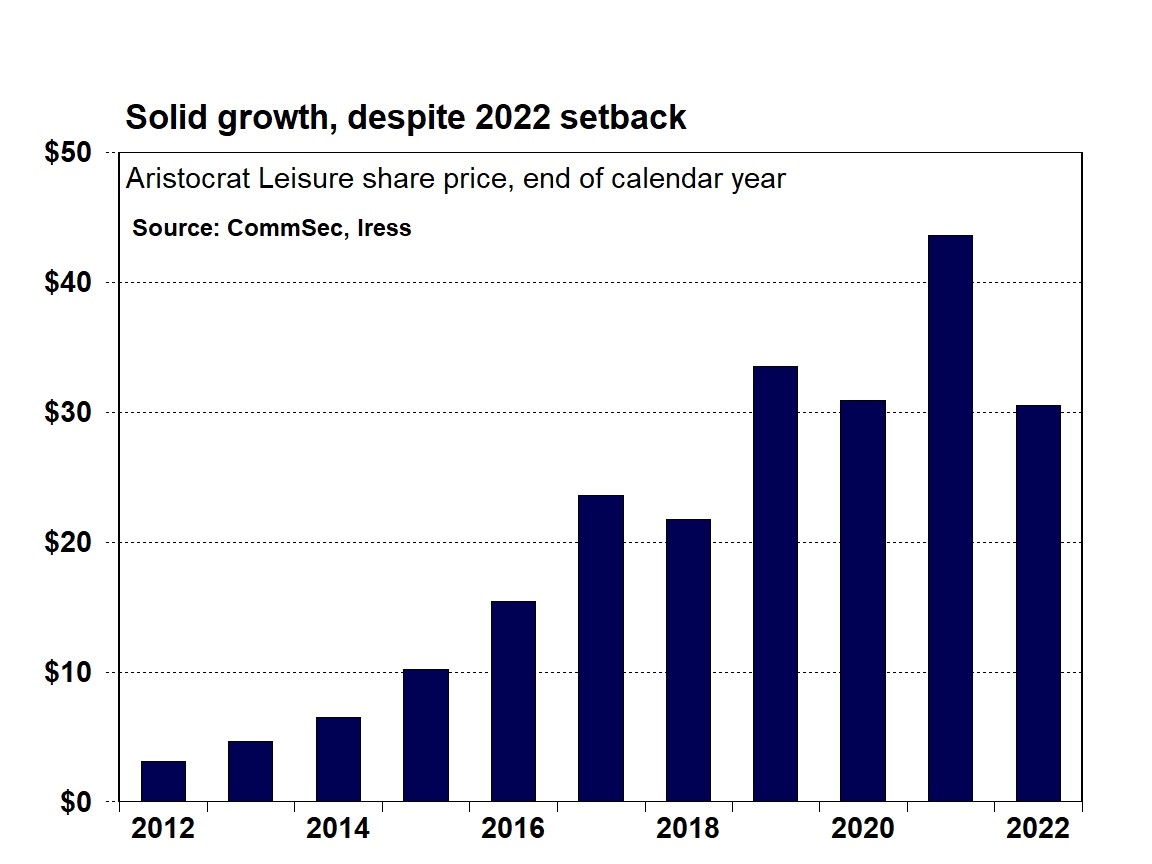
Somewhat surprisingly, gaming company, Aristocrat Leisure (ALL), is the top performer, its share price and dividend returns soaring over 972 per cent over the past decade (Source: Iress ‘Total Return’).
Gold explorer, Northern Star (NST), was next highest with returns up 871 per cent, ahead of Mineral Resources (MIN), ResMed (RMD) and Fortescue Metals Group (FMG).
Of the companies providing the biggest dollar returns, Macquarie Group was 6th in the rankings of total returns over the decade with CSL 7th, Cochlear 12th and Rio Tinto 15th.
Source: Iress Total Return
The ‘So What?’ question
What if you didn’t purchase shares a decade ago? What is the value of the analysis? Well, there are a number of things to consider.
Companies change over time – different strategies, different management. And investors have to decide whether they believe that the new or changed circumstances will generate value over time.
Economic and industry conditions also change and they can affect companies in different ways. So it pays to keep track of portfolio performance.
So when you buy your share investment could indeed be important as the time you make the decision to sell.
And exercises such as tracking the performance of stocks over a decade are valuable from a research perspective.
What are the out-performers doing that the under-performers aren’t? Have relative industry conditions changed to the effect that portfolios should be re-assessed? Indeed, have economic conditions changed to the extent that there is value in switching your portfolio investment theme from aggressive to conservative or balanced?
The bottom line is that economic, financial and industry conditions are constantly changing. Companies are constantly changing. So investors should always be alert to the potential risks and opportunities that are presented.
Addendum: Statistics, damn statistics
As noted above, the data on share prices and dividends are supplied by Iress and the total return calculation assumes that the dividends are not reinvested over time.
The net dollar returns are calculated as: (100*(end 2022 share price + dividends from 2013-2022))-(end 2012 share price *100).
Results from other vendors such as Bloomberg are slightly different due to slightly different calculations and data collections.
Costs, fees or taxes are not included.
There are a few other points to also consider from the analysis.
First, the gains we are highlighting would only be realised for the investor when the shares are sold. An investor buying 100 shares in CSL at the end of 2012 would have seen the value of the investment lift from near $5,500 to $29,000. But those gains are purely ‘paper gains’ until the investor makes the decision to sell part or all the holding.
Second, is the time horizon. We have looked at share price performance at a discreet 10-year time increment, measuring from end-year levels. But clearly performance can change markedly, depending on when you purchase the shares and when you sell.
Third, is the complication of dividend payments. The investor may have elected to receive the dividends in cash over time. If that is the case, the dollars may have been used for a raft of purposes. But if the dividends are reinvested as part of a dividend reinvestment program, then that complicates the analysis.
Fourth, are the tax considerations involved in holding or selling shares as well as the considerations about what to do with dividends paid over time. You may need to seek your own individual tax advice to determine what the impacts will be to you.
Fifth, follows directly on from the third point above. The decisions made on holding or selling shares, dividends and taxes will vary with each investor.